Transcriptomics
This web page was produced as an assignment for Genetics 564, an undergraduate capstone course at UW-Madison.
What is Transcriptomics?
Transcription is the process of genes being transcribed into mRNA. The transcriptome is the complete collection of all RNA transcripts in an organism. Transcriptomics is the use of biotechnology such as microarrays and RNA-sequencing to analyze gene expression [1]. Microarrays detect nucleic acids in a sample by hybridization to probes on microchips. RNA-seq harnesses the technology of next-generation sequencing. RNA-seq allows us to extract all of RNA in a sample, and can yield readouts of billions of bases a day. Using transcriptomics allows us to determine the level of expression of every gene in each cell.
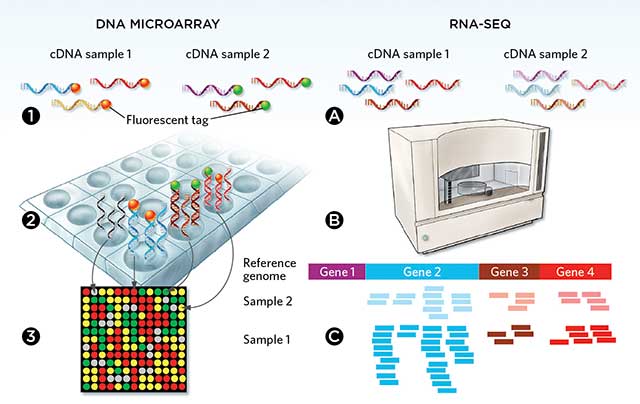
Figure 1. Two ways to conduct transcriptomics: Microarray consist of nucleic acid probes affixed to a surface. Scanning the microarray measures the gene expression of each spot. In RNA-seq, RNA is extracted, converted into cDNA, then sequenced using next-generation sequencing.
The G6PD Transcriptome
|
GEO Profiles
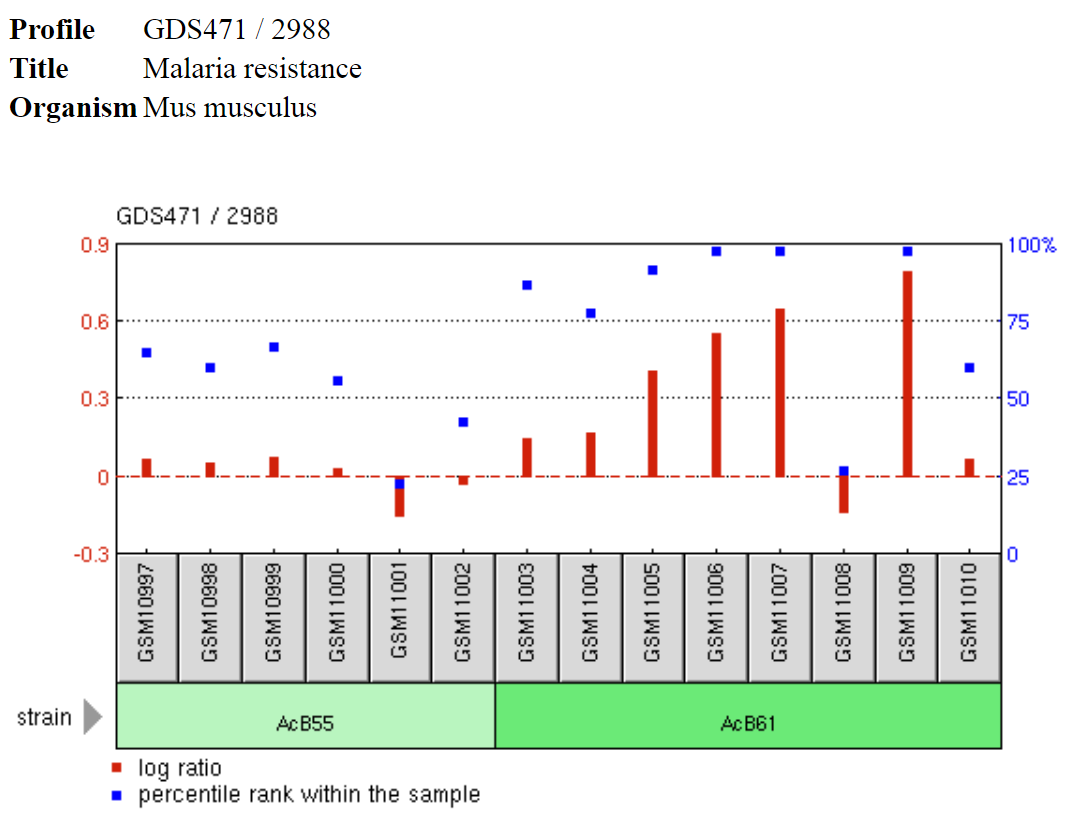
GEO Profiles presents experimental results of gene expression of one gene across all samples of that gene in one study or dataset (show on right). This specific example shows the increase in G6PD gene expression associated with malaria resistance [2]. Studies have shown that G6PD remains in populations particularly where malaria is endemic because it confers some resistance to malaria. Using transcriptomics tools, we can quantify the level of G6PD gene expression associated with malaria resistance. 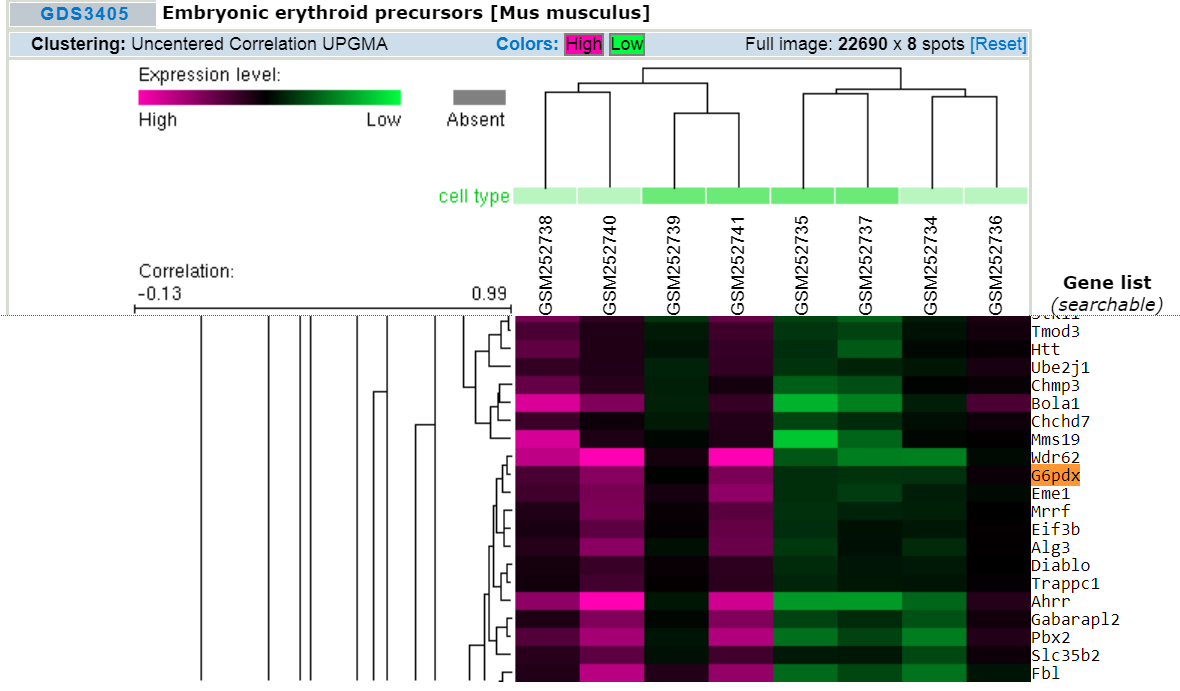
|
Hierarchically Clustering Data
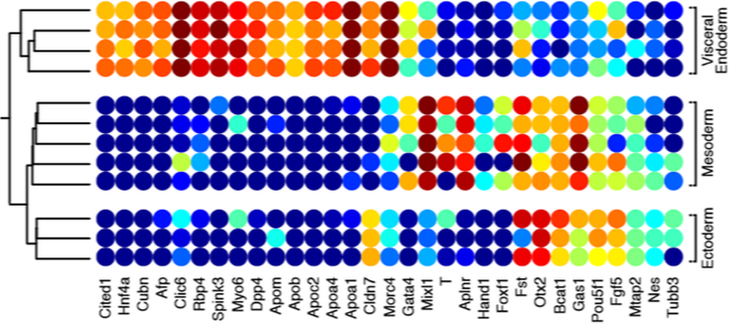
Cluster heat mapping (from GEO DataSets )shows genes that are highly correlated with a phenotype or process. The genes shown to be highly expressed on the left are correlated with embryonic erythroid precursors. In mice, the expression of G6pdx (homologous to human G6PD) is highly associated with embryonic erythroid precursors. |
Discussion
Single-cell transcriptomics will allow me to analyze the level of G6PD expression in each cell. I can use this to create cluster maps that show me which cells are more likely to be G6PD deficient, and which cells are more closely associated with oxidative stress and hemolytic anemia. I can also do temporal treatments: before and after addition of methylation to determine how the gene expressions in the cells change.
